
Many Americans are not even aware of what their credit score is while it’s a really important factor so vital for your wellbeing. We analyzed loads of data to find out how US average credit score has behaved within the last 7 years and what were the reasons for its growth or decrease. This information will definitely help every US resident to fill in the whole picture of what’s going on with their finances and economy of the country. Besides, you’ll be able to discover the ways how to improve your credit history and get better opportunities.
Alternative Loan Offers for Instant Cash
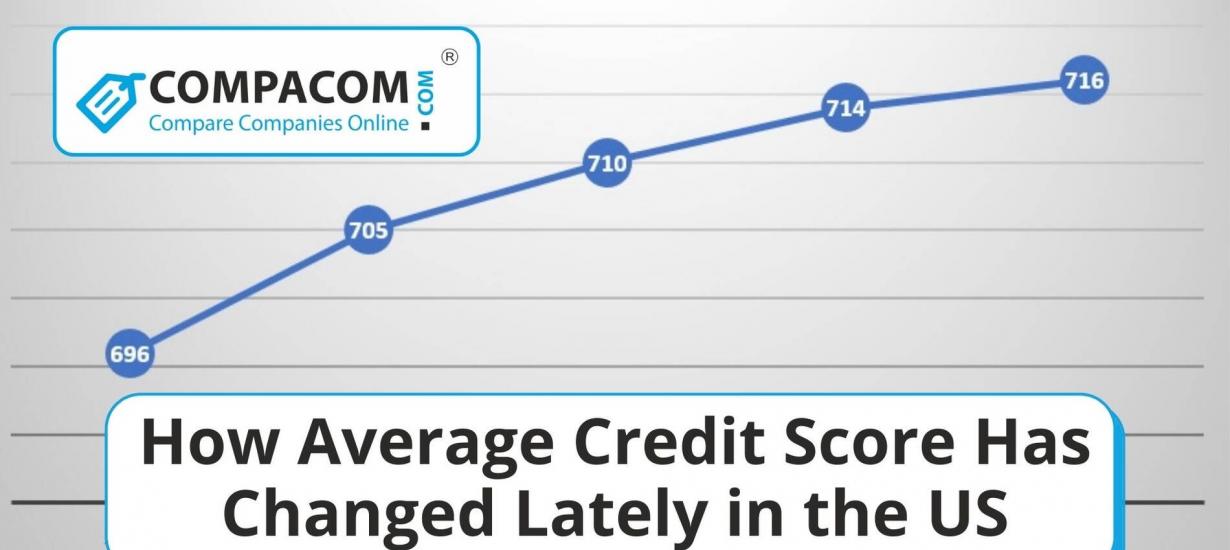
What’s the Average Credit Score and How It Has Changed Recently?
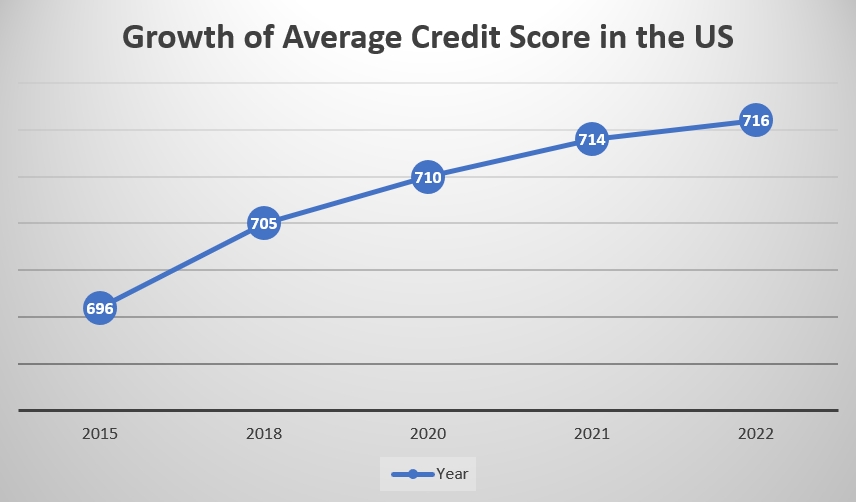
According to the FICO credit score statistics, the average credit score among US residents has grown from 696 (which is poor credit score) to 716 (good credit) since 2015.
|
Year |
Average Credit Score |
Difference |
|
2015 |
696 |
+9 |
|
2018 |
705 |
+5 |
|
2020 |
710 |
+5 |
|
2021 |
714 |
+4 |
|
2022 |
716 |
+2 |
Let’s look at these data at the diagram below and we’ll vividly see how the average credit score has constantly been growing within the past 7 years:
What contributed to the credit score growth?
Before we define what influenced the changes in credit score, we need to remember which factors actually affect the score rating.
There are a number of factors that can affect your credit scores. Payment history, outstanding debt, and credit utilization are some of the most important. Your credit utilization ratio, which is the amount of revolving credit you're using divided by your total revolving credit limit, is a key factor in your scores.
Additionally, the length of your credit history and the mix of different types of credit accounts you have (e.g. car title loan, credit card, student loan, mortgage) can also impact your scores. Finally, new credit accounts and hard inquiries from lenders can also lower your scores.
Payment history and its affect on the Credit Score Change
Missed payments have actually decreased significantly. According to the report from FICO, as of April 2021 just 15% of Americans have had a missing payment that was more than 30 days past its due date. The year before, however, 19.6% of Americans had missed a payment.
As late payments constitute 35% of the factors influencing credit score, we can conclude that the decrease in this figure has a positive impact on the credit score growth.
Payments, and credit utilization rate
Average credit card debt, and consequently credit utilization rate, has become a smaller portion of Americans' total debt within the last years dropping from 5.9% to 5.3%.
|
2015 |
$703 billion |
$11.85 trillion |
5.9% |
|
2016 |
$729 billion |
$12.29 trillion |
5.9% |
|
2017 |
$784 billion |
$12.84 trillion |
6.1% |
|
2018 |
$829 billion |
$13.29 trillion |
6.2% |
|
2019 |
$868 billion |
$13.86 trillion |
6.3% |
|
2020 |
$817 billion |
$14.27 trillion |
5.7% |
|
2021 |
$787 billion |
$14.96 trillion |
5.3% |
Debt-to-income Ratio and Credit Score
Debt to income ratio is an important indicator of financial health. It is calculated by taking your monthly expenses and dividing them by your monthly income. For example, if you spend $5,000 a month and earn $7,500 a month, your DTI is 66%. This means you are in dire need of a financial overhaul.
To define the changes in the debt-to-income ratio, let’s see how these data have been changing:
|
Year |
Average Household Income |
Average Household Debt |
|
2015 |
$58,476 |
$50,971 |
|
2018 |
$64,324 |
$92,727 |
|
2021 |
$79,900 |
$145,000 |
While the income has been growing, the debt has been increasing too. Is it bad or good for your credit history? Practically, it doesn’t have any impact on your credit history! But the lower it is, the more creditworthy a borrower you are considered. And many lenders can take into account your debt-to-income ratio instead of doing a hard credit check in order to approve you for a loan. In any case, you can always get approved for online Payday Loans with no credit check.
Average American portfolio of credit accounts
The more diverse it is the better. And the better you manage all your credits the higher score you are likely to have.
According to Statista1, the average debt types have been changing in the following way since 2017:
|
Credit type |
2017 |
2018 |
2019 |
2020 |
2021 |
|
Credit card bills |
19% |
25% |
22% |
22% |
19% |
|
Mortgage |
29% |
25% |
22% |
21% |
24% |
|
Car Loans |
6% |
7% |
9% |
8% |
8% |
|
Personal education loans |
7% |
6% |
8% |
8% |
7% |
|
Educational expenses |
3% |
4% |
4% |
5% |
3% |
|
Home equity/ line of credit |
3% |
4% |
3% |
4% |
4% |
|
Medical expenses |
------- |
2% |
------- |
3% |
----- |
|
No debt |
27% |
23% |
27% |
26% |
32% |
As we can conclude, loans spent on education, medicine, car loans stay more or less similar, while credit card bills tend to decrease. Meanwhile, the number of Americans with no debt has increased from 27% to 32%. The less debt people owe the higher their credit score is – it’s obvious.
The fact that all these types of credit stay equally popular may also have a good affect on credit history. The more varied the person’s credit account portfolio is the higher FICO rating he’ll have providing he makes on time payments on these debts.
New Credit – How the Number of Credit Accounts Has Changed
Let’s investigate how the number of various risk tier credit card accounts has been changing lately:
|
|
2015 |
2016 |
2017 |
2018 |
2019 |
2020 |
|
Subprime |
63 |
73 |
75 |
75 |
77 |
64 |
|
Prime |
87 |
93 |
102 |
104 |
101 |
98 |
|
Super Prime |
166 |
176 |
185 |
191 |
194 |
203 |
While subprime and prime accounts have declined, the number of super prime credit card owners has significantly grown which may indicate their better opportunities to improve credit score and other financial issues.
82% of all open credit card accounts are held by prime and superprime borrowers, according to the ABA report2. This suggests that those with the best credit have plenty of options to choose from.
The number of prime and subprime accounts dropped to levels not seen since 2015-2016, but the number of superprime accounts hit an all-time high. This indicates that borrowers with excellent credit are well-positioned to take advantage of current conditions.
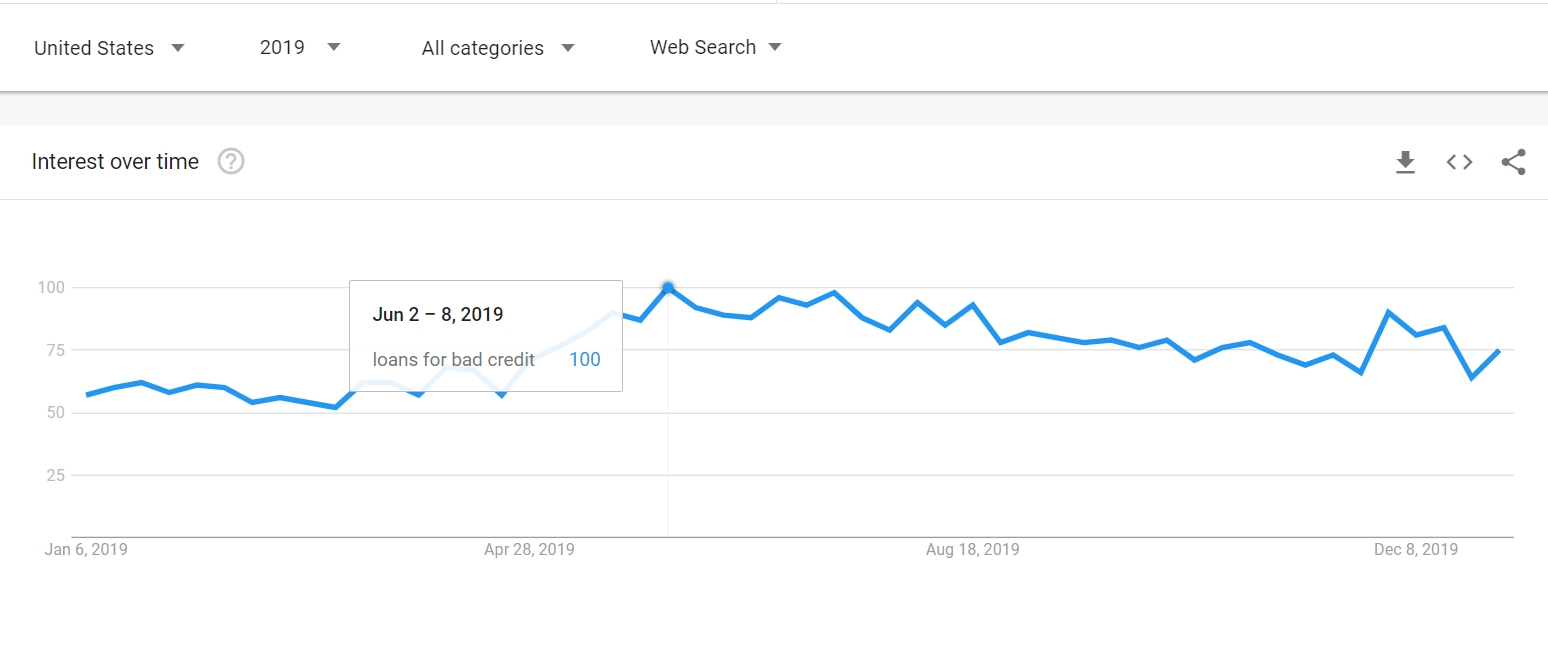
How many US residents applied for bad credit loans 2015 – 2022
In 2019 the interest in bad credit loans reached its peak of 100% only once at the beginning of June.
While in 2021 the same search query was much more popular. It was at the rate of 100% several times during the year for rather long periods.
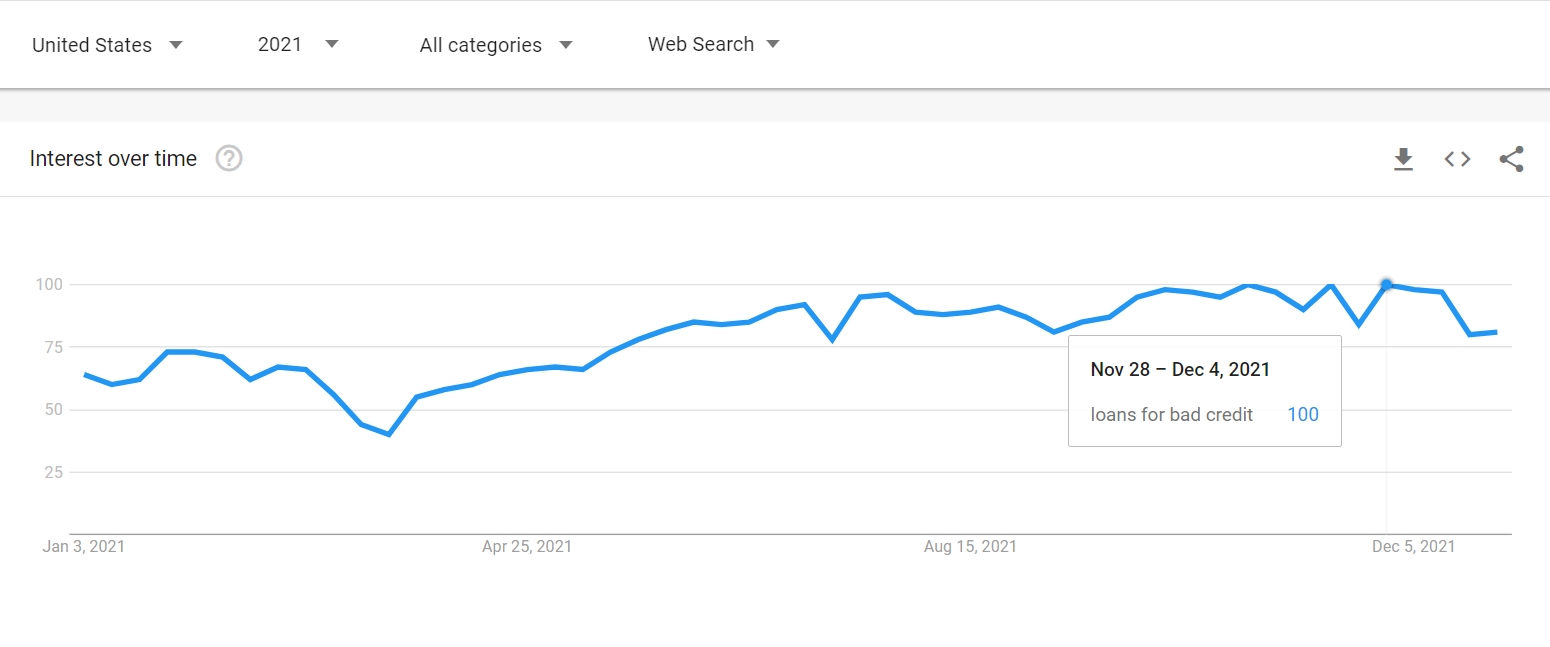
The google trends show that the number of bad credit loan borrowers is constantly growing. On the one hand, it means that more people with poor credit need emergency financing which may be bad for their credit rating in case they default on their loans. On the other hand, applying for various loan types can affect your credit history in a better way if you handle them responsibly!
Summary
- US average credit score is growing day after day.
- The main reasons for credit score improvement are fewer missed payments and less household debt.
- Still, there’re lots of Americans who look for bad credit loans either due to their poor credit rating or to the country’s economic situation at these hard times of Covid-19 and other misfortunes.
- Anyway, the tendency is positive and hopefully will remain at such level in the future.
You are about to post a question on compacom.com:
Any comments or reviews made on this website are only individual opinions of the readers and followers of the website. The website and its authors team are not responsible, nor will be held liable, for anything anyone says or writes in the comments. Further, the author is not liable for its’ readers’ statements nor the laws which they may break in the USA or their state through their comments’ content, implication, and intent.